One - stop Electronic Manufacturing Services(EMS) Solution provider


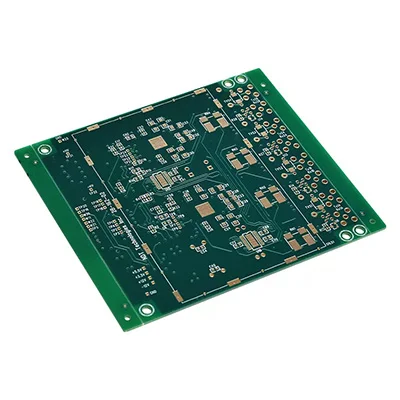
What is High TG PCB
What is High TG PCB
A high TG PCB is a board with a high glass transition temperature. "TG" is the temperature point at which the material begins to transition from a solid state to a rubbery state. Changes in physical shape can certainly adversely affect their functionality and performance. If your PCB works under high temperature for a long time, you'd better choose high TG material.
High TG PCBs indicate that their TG values are generally above 170 °C. Standard PCBs are typically manufactured using materials with a TG value of 140°C and can withstand operating temperatures of 110°C. But standard PCBs may not be suitable for the extreme temperature environments common in industrial, automotive, and other high-temperature electronics applications. When it comes to these situations, FR4 material will be the best solution.
The thermal resistance of FR4 materials is much higher than that of standard PCBs. When selecting a PCB, the TG value should be at least 20-25°C higher than the expected operating temperature of the PCB. For example, if the TG value of PCB is 170°C, then the operating temperature of the device should be lower than 150°C.
High TG PCBs perform better at high temperatures and are more stable, making them a logical solution for high power density designs. The higher the TG of the board, the higher the heat resistance, chemical resistance and mechanical stability of the electronic device.
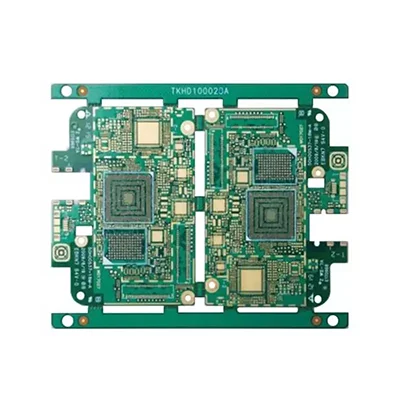
High TG PCB vs multi-layer PCB and high-density circuit board. These pcbs will generate more heat because the components in multi-layer PCB and HDI PCB are more compact and the circuit is very dense. High-TG PCBs have good thermal control capabilities to help ensure product reliability during operation.
We all know that if an electronic product is often used for a long time, the heat generated during the working process will be transferred to other components, which will eventually affect the durability and performance of the product. For some electronic products in applications that have multiple functions but are limited by size and weight, high thermal power PCB will be a cost-effective way to improve thermal management efficiency
High Tg means high heat resistance. With the rapid development of the electronics industry, especially electronic products represented by computers, are developing towards high functionality and high multi-layers, which requires higher heat resistance of PCB substrate materials as an important guarantee. The emergence and development of high-density mounting technologies represented by SMT and CMT have made PCB more and more inseparable from the support of high heat resistance of the substrate in terms of small aperture, fine line, and thinning.
PCB substrate materials not only soften, deform, melt, etc. at high temperatures, but also show a sharp decline in mechanical and electrical properties (I think you don't want to see this happen to your products). Therefore, the difference between general FR-4 and high Tg FR-4 is that the mechanical strength, dimensional stability, adhesion, water absorption, and thermal decomposition of the material are in the hot state, especially when heated after moisture absorption. There are differences in various conditions such as thermal expansion, and high Tg products are obviously better than ordinary PCB substrate materials.
1. Dilatometer method Fill the dilatometer with an appropriate amount of the polymer to be tested, fill the dilatometer with an inert liquid that does not dissolve the polymer to be tested under negative pressure by vacuuming, and then place it in the oil bath with A certain heating rate is used to heat the dilatometer, and record the change of the height of the inert liquid column with temperature.
Due to the sudden change in the volume of the high molecular polymer before and after the glass transition temperature, there is a corresponding inflection point on the height-temperature curve of the inert liquid column. The temperature corresponding to the inflection point is the glass transition temperature of the tested polymer.
2. Refractive index method Use the change of the refractive index of the polymer before and after the glass transition temperature to find out the glass transition temperature that causes this change.
3. Thermomechanical method (temperature-deformation method) Apply a constant load to the polymer sample in a heating furnace or an environmental chamber; record the temperature-deformation curve at different temperatures. Similar to the dilatometer method, find the temperature corresponding to the inflection point on the curve, which is the glass transition temperature.
4. The DTA method (DSC) takes the glass transition temperature as the boundary, and the physical properties of the polymer show significant changes with the change of the freedom of movement of the polymer chain segment. An efficient measure of the glass transition temperature of molecular materials.
At present, the thermal analysis methods used to determine the glass transition temperature are mainly differential thermal analysis (DTA and differential scanning calorimetry (DSC and thermomechanical method). Taking DSC as an example, when the temperature gradually increases, through the polymer At the glass transition temperature of , the baseline on the DSC curve moves towards the endothermic direction.
Point A is the point where you start to deviate from the baseline. Extend the baseline before and after the transformation, the vertical distance between the two lines is the step difference ΔJ, at ΔJ/2 point C can be found, draw a tangent line from point C and intersect the previous baseline at point B, the temperature value corresponding to point B is is the glass transition temperature Tg. The thermomechanical method is to directly record the glass transition temperature process without conversion, which is more convenient.

5. Dynamic mechanical performance analysis (DMA) method The dynamic performance analysis (DMA) of polymer materials obtains the dynamic mechanical response of polymer materials by applying sinusoidal alternating loads on the tested high molecular polymers. For elastic materials (materials without viscoelastic properties), there is no phase difference between the dynamic load and its induced deformation (ε=σ0sin(ωt)/E).
When the material has viscoelastic properties, the deformation of the material lags behind the applied load, and a phase difference δ appears between the load and the deformation: ε=σ0sin(ωt+δ)/E.
Expand the stress-strain relationship including the phase angle according to the trigonometric function relationship,
Define the storage modulus G'=Ecos(δ) corresponding to the elastic properties and the loss modulus G”=Esin(δ) corresponding to the viscoelasticity, so it is called the absolute modulus E=sqrt(G'2+G ”2) Due to the existence of the phase angle difference δ, energy loss occurs when the external load loads the viscoelastic material. This property of a viscoelastic material becomes its damping of external forces.
Damping coefficient γ=tan(δ)=G’’/G’ It can be seen that the viscoelasticity of polymer is reflected in the strain lag phase angle. When the temperature develops from low to high and passes through the glass transition temperature, the structure of the polymer inside the material changes, and the viscoelasticity related to the molecular structure changes accordingly.
This change is simultaneously reflected in the storage modulus, loss modulus and damping coefficient. The figure below is the DMA curve of polyacetamide. The vibration frequency is 1Hz. Between -60 and -30°C, the storage modulus decreases and the damping coefficient peaks corresponding to changes in the internal structure of the material. The corresponding temperature is the glass transition temperature Tg.
6. Nuclear Magnetic Resonance (NMR) After the temperature rises, the molecular motion is accelerated, and the proton environment is averaged (the protons with magnetic moments at high energy and the protons with magnetic moments at low energy begin to approach in number; N-/ N+=exp(-E/kT)), the resonance spectrum line becomes narrower.
To the glass transition temperature, Tg, the width of the spectral line has a great change. Taking advantage of this phenomenon, the glass transition temperature of polymer materials can be obtained by analyzing its spectral lines with a nuclear magnetic resonance instrument.
- Previous:High TG High Frequency Rogers 5880 PCB
- Next:No