
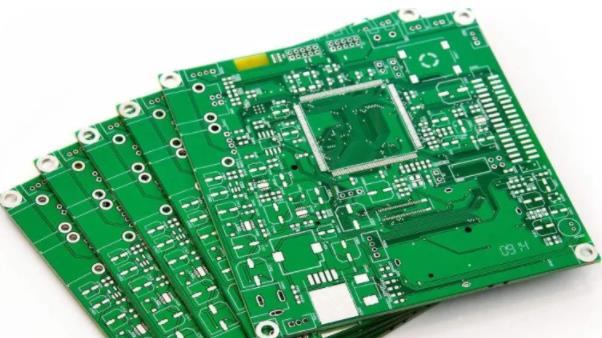
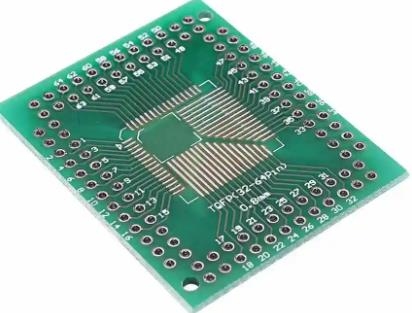
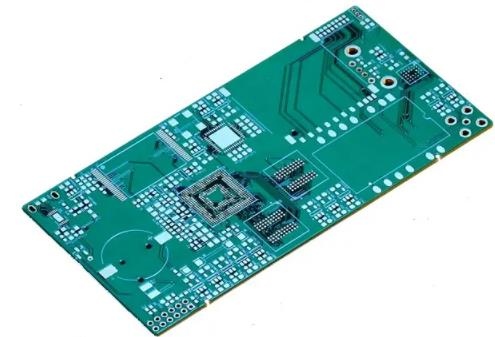
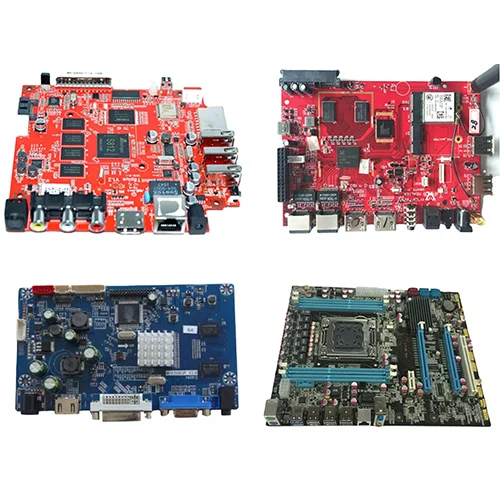
Professional PCB manufacturing and assembly
Building 6, Zone 3, Yuekang Road,Bao'an District, Shenzhen, China
+86-13410863085Mon.-Sat.08:00-20:00

Understanding of PCB Design Standing Wave Diagram on Interconnection and Antenna
The reflection of electromagnetic wave is a basic phenomenon in physical systems, but it may not be required in electronic equipment. Standing wave patterns formed on conductive components such as transmission lines in PCB boards will emit strong radiation, which may not be ideal. For antennas, standing waves are natural and generate strong radiation at specific frequencies, while they can interfere with transmission lines.
When you want to control the standing wave diagram, you need to design the reflection in the interconnects and antennas through impedance control and impedance matching. Depending on the degree of impedance mismatch, you can understand the standing wave mode you want to see on the interconnect when driving with harmonic signals. For wideband signals such as digital pulses, the results are much more complex, but the same concepts can be applied with the correct PCB design and analysis toolset.
How reflection forms standing wave mode
Standing wave can be formed in many physical systems, and in some cases, standing wave corresponds to the resonant frequency of the system eigenmode. In electronic products, when the electromagnetic wave propagating on the interconnection reflects the interface with impedance mismatch, standing wave will be formed.
When the reflected wave and the incident wave are completely in phase, a standing wave will be formed, and the standing wave is displayed as a fixed sine wave along the length of the interconnection line.
If you look at the electric field along the entire length of an interconnection that contains standing waves, the electric field looks like a standing wave. Standing wave can form a certain range of frequencies. This means that if there is reflection at one end of the interconnection, the single harmonic AC power supply can stimulate a strong reputation. PCB processing and PCB assembly plants explain the understanding of PCB design, interconnection and standing wave diagram on the antenna.
Here, we need two pieces of information to calculate the standing wave excitation frequency and describe the reflection and superposition of waves on the interconnection:
Reflection coefficient: the reflection coefficient at the interface is used to describe the intensity and phase shift experienced by waves when reflecting from the interface.
Length of interconnection or antenna: once reflection occurs, the wave will propagate backward through the length of the structure. The standing wave pattern will only be formed on the electrically long structure, and its length will determine the allowable standing wave frequency/wavelength.
Wave propagation speed: The wave propagation speed (i.e. the speed of light on the interconnection) will determine the wavelength of the standing wave, thus determining the specific frequency that can excite the standing wave.
The reflection that occurs when the impedance does not match may occur on the transmission line, on the interface between the transmission line and the antenna, or in the antenna. Let's look at each case to better understand how these standing wave modes are formed.
Transmission line
In order to deal with transmission lines, we need to use the source and load side impedances in the reflection structure to calculate the reflection coefficient. The figure below shows the standing wave mode that may be formed when the AC harmonic wave is reflected from two common impedances, which are at each end of the interconnection. This is a common example in a transmission line where a load has a specific impedance value and may terminate at its output. When the transmission line is long enough, the reflection coefficient is defined on the interface according to the characteristic impedance and load impedance of the transmission line.
The reflection coefficient and standing wave diagram in the interconnection are formed.
At a specific frequency, the transmission line will support the standing wave diagram shown above. Outside the line, some power is transmitted to the load, which may suffer losses outside the line. The load may be some simple component, antenna or complex circuit. Usually, these standing wave diagrams are not needed because there is a large oscillation on the line, which will generate radiation. Due to the mismatch between the line and the antenna, these oscillations may also occur on the antenna feeder. However, inside the antenna, the situation is different.
Antenna standing wave
Because the impedance at the open end of the antenna does not match, standing waves will form on the antenna. For the air beyond the antenna boundary, there is impedance mismatch. At a specific frequency, a standing wave pattern corresponding to a specific eigenmode of the antenna structure can be excited, similar to what happens in a resonator or waveguide. Adjusting the modal frequency is an important task in antenna design, and it is still an ongoing research topic.
Although the antenna has standing wave, we do not want the place where the standing wave is located to be the feeder. The standing wave in the feeder will interfere with other parts of the PCB, so it is necessary to eliminate the reflection at the antenna input. This is one of the reasons why we use impedance matching network to set the antenna input impedance and feeder characteristic impedance equal.
Extract impedance and S parameters of broadband signal
For broadband signals, we need the S parameter of the system, because this is the best way to deal with reflection. Unless a specific frequency dominates the power spectrum of the signal, the coherent standing wave diagram shown above may not be formed. In order to best understand how broadband signals interact with resonant structures, it is best to use the S parameter. The best design software can determine the impedance and network parameters directly from your layout, enabling you to identify the potential for strong reflections and standing waves in the layout. PCB processing and PCB assembly plants explain the understanding of PCB design, interconnection and standing wave diagram on the antenna.


Just upload Gerber files, BOM files and design files, and the KINGFORD team will provide a complete quotation within 24h.